by Jiawei Han
1. Cluster Analysis: An Introduction
2. Similarity Measures for Cluster Analysis
3. Partitioning-Based Clustering Methods
4. Hierarchical Clustering Methods
5. Density-Based and Grid-Based Clustering Methods
6. Probabilistic Model-Based Clustering Methods
7. Methods for Clustering Validation
8. Clustering High-Dimensional Data
9. Constraint-Based Clustering
10. Clustering Graphs and Networked Data
11. Cluster Analysis in Heterogeneous Networks
12. Advanced Topics and Applications
1. Cluster Analysis : An Introduction
1.1 Motivation & Definition
Imagine you're the Director of Customer Relationships at AllElectronics, and you have five managers working for you. You would like to organize(or partition) all the company's customers into five groups so that each group can be assigned to a different manager. Strategically, you would like that the customers in each group are as similar as possible.
Unlike in classification(i.e., supervised learning), the class label (or group_ID) of each customer is unknown(i.e., we do unsupervised learning which is a form of learning by observation, rather than learning by examples). You need to discover these groupings. Given a large number of customers and many attributes describing customer profiles, it can be very costly or even infeasible to have a human study. Thus, we need a clustering tool to help.
Clustering is the process of grouping a set of data objects into multiple groups or clusters(treated as implicit classes) so that objects within a cluster have high similarity, but are very dissimilarity to objects in other clusters.
As a data mining function, cluster analysis can be used as a standalone tool to gain insight into the distribution of data, to observe the characteristics of each cluster, and to focus on a particular set of clusters for further analysis. Alternatively, it may serve as a preprocessing step for other algorithms, such as characterization, attribute subset selection, and classification, which would then operate on the detected clusters and the selected attributes or features. Thus, clustering is sometimes called automatic classification or data segmentation.
1.2 Applications of Cluster Analysis
ㆍA key intermediate(i.e., preprocessing) step for other data mining tasks
└ Generating a compact summary of data for classification, pattern discovery, hypothesis generation and testing, etc.
└ Outlier detection: Outliers -those "far away" from any cluster
ㆍData summarization, compression, and reduction
└ Ex. Image processing: Vector quantization
ㆍCollaborative filtering, recommendation systems, or customer segmentation
└ Find like-minded users or similar products
ㆍDynamic trend detection
└ Clustering stream data and detecting trends and patterns in dynamic stream data
ㆍMultimedia data analysis, biological data analysis and social network analysis
└ Ex. Clustering images or video/audio clips, gene/protein sequences, etc.
1.3 Cluster Analysis: Requirements and Challenges
ㆍScalability:
Many clustering algorithms work well on small data sets. However, clustering on only a sample of a given large data set may lead to biased results. Therefore, highly scalable clustering algorithms are needed.
ㆍAbility to deal with different types of attributes:
Cluster algorithms should be designed to cluster not only (of course) numeric (interval-based) data, but also binary, nominal (categorical), ordinal data, mixtures of the data types, and more complex data types such as graphs, sequences, images and documents.
ㆍDiscovery of clusters with arbitrary shape:
Cluster algorithms based on distance measures (ex. Euclidean, Manhattan) tend to find spherical clusters with similar size and density. However, a cluster could be of any shape according to data type (ex. Sensor data from fire detection which is not spherical). Therefore, it's important to develop algorithms that can detect clusters of arbitrary shape.
ㆍRequirements for domain knowledge to determine input parameters:
Many clustering algorithms require users to provide domain knowledge in the form of input parameters such as the desired number of clusters because the clustering results may be sensitive to such parameters and parameters are often hard to determine, especially for high-dimensionality data sets and where users have yet to grasp a deep understanding of their data. However, requiring the specification of domain knowledge not only burdens users, but also makes the quality of clustering difficult to control.
ㆍAbility to deal with noisy data:
Most real-world data sets contain outliers and/or missing, unknown, or erroneous data (e.g., Sensor data). Clustering algorithms can be sensitive to such noise and may produce poor-quality clusters. Therefore, we need clustering methods that are robust to noise.
ㆍIncremental clustering and insensitivity to input order:
In many applications, incremental updates (representing newer data) may arrive at any time. Some clustering algorithms can't incorporate incremental updates into existing clustering structures and, instead, have to recompute a new clustering from scratch. Clustering algorithms may also be sensitive to the input data order. That is, given a set of data objects, clustering algorithms may return dramatically different clusterings depending on the order. As a result, incremental clustering algorithms and algorithms that are insensitive to the input order are needed.
ㆍCapability of clustering high-dimensionality data:
Most clustering algorithms are good at handling low-dimensional data. However, finding clusters of data objects in a high-dimensional space is challenging, especially considering that such data can be very sparse and highly skewed.
ㆍConstraint-based clustering:
Real-world applications may need to perform clustering under various kinds of constraints(e.g., user-given preferences or constraints, domain knowledge, user queries). Thus, a challenging task is to find data groups with good clustering behavior that satisfy specified constraints.
ㆍInterpretability and usability:
Users want clustering results to be interpretable, comprehensible, and usable. That is, clustering may need to be tied in with specific semantic interpretations and applications. It's important to study how an application goal may influence the selection of clustering features and clustering methods.
1.4 Orthogonal aspects for Cluster Analysis
ㆍPartitioning criteria:
All the objects are partitioned so that no hierarchy exists among the clusters. That is, all the clusters are at the same level conceptually. Such a model is useful, for example, for partitioning customers into groups so that each group has its own manager. Alternatively, other methods partition data objects hierarchically, where clusters can be formed at different semantic levels.
ㆍSeparation of clusters:
Some methods partition data objects into mutually exclusive clusters. That is, a data object (e.i., one customer) belongs to only one cluster(i.e., one group operated from one manager). In some other situations, the clusters may not be exclusive, that is, a data object may belong to more than one cluster. For example, when clustering documents into topics, a document may be related to multiple topics.
ㆍSimilar measure:
Some methods determine the similarity between two objects by the distance (e.g., Euclidean space, a road network, a vector space) between them. In other methods, the similarity may be defined by connectivity based on density or contiguity, and may not rely on the absolute distance. While distance-based methods can often take advantage of optimization techniques, density- and continuity-based methods can often find clusters of arbitrary shape.
ㆍClustering space:
Many clustering methods search for clusters within the entire given data space. These methods are useful for low-dimensionality data sets. However, with high-dimensional data, there can be many irrelevant attributes, which can make similarity measurements unreliable. That is, clusters found in the full space are often meaningless. It's often better to instead search for clusters within different subspaces of the same data set. Subspace clustering discovers clusters and subspaces (often of low dimensionality) that manifest object similarity.
1.5 Overview of Basic Clustering Methods
Some clustering algorithms integrate the ideas of several clustering methods. That is, since some categories may overlap, it's difficult to provide a crisp categorization of clustering method. Nevertheless, it is useful to present a relatively organized picture of clustering methods.
ㆍPartitioning methods:
ㆍHierarchical methods:
ㆍDensity-based methods:
ㆍGrid-based methods:
2. Similarity Measures for Cluster Analysis
Lecture 3
Partitioning-Based Clustering Methods
Partitioning method : Discovering the groupings in the data by optimizing a specific objective function(ex.SSE) and iteratively improving the quality of partitions.
The K-Means Clustering Method
- Efficiency : O(tKn) where n: # of objects, K: # of clusters, and t: # of iterations; Normally, K, t<
- often terminates at a Local optimal : Initialization can be important to find high-quality clusters -> 따라서, multiple random initialization을 실시한 후, SSE가 가장 적은 case를 선택한다.
- In advance need to specify best K, # of clusters, by using Elbow method, 일정 범위의 K에서 cost 변화가 급격히 이뤄지는(Elbow모양) 구간의 K를 선택한다. (반대로, hierarchical clustering은 iteration이 끝난 후, dendrogram을 통해 user가 직접 K를 선택할 수 있다. )
- Sensitive to noisy data and outliers becuase calculating 'mean' is sensitive to outliers (보완 : K-Medians, K-Medoids, etc)
- K-means is applicable only to objects in a continuous n-dimensional space. (보완 : Using the K-Modes for categorical data )
- Not suitable to discover clusters with non-convex shapes. (보완 : Using Density-based clustering, Kernel K-Means, etc.)
There are many variants of the K-Means method, varying in different aspects
- Choosing better initial centroid estimates ( K-means++, Intelligent K-Means, Genetic K-Means )
- Choosing different representative prototypes for the clusters ( K-Medoids, K-Medians, K-Modes )
- Applying feature transformation techniques ( Weighted K-Means, Kernel K-Means )
Kernel K-Means Clustering
- Kernel K-Means can be used to detect non-convex clusters ( 반면, K-Means can only detect clusters that are linearly separable )
- IDEA : (Step-1) Project data points onto the high-dimensional feature space using the kernel function, and then (Step-2) perform K-Means on the mapped feature space.
- Computational complexity is higher than K-Means because we need to compute and store n x n kernel matrix generated from the kernel function on the original data.

- By using Kernel Function (= Similarity Function ), we can project the original data onto the high-dimensional kernel space.
- Kernel Function은 dot product를 계산하는 것이 특징이므로, 나와 다른 모든 point간의 similarity(=distance)를 측정하게 해준다. 따라서 Kernel space의 matrix는 covariance matrix와 흡사하다.
- 이처럼, 모델에 적용되는 feature를 transform하면서 feature 갯수를 많이 늘려줌으로써 알고리즘이 더욱 더 정교하게 작동할 수 있도록 도와준다. 이와같은 high-feature때문에 거리에 대해서 민감하기 때문에 non-convex data에도 잘 동작한다.
Lecture 4
Hierarchical Clustering Methods
The hierarchical partitioning can be continued recursively until a desired granularity is reached by grouping data objects into a hierarchical or 'tree' of clusters.
- Not required to specify K, # of clusters ( User가 clustering 완료후, dendrogram을 보고 가장 거리가 큰 지점을 이용해 K를 선택할 수 있다. )
- 2가지 종류 : 1. Agglomerative : bottom-up 방식 , 2. Divisive : Top-down 방식
Agglomerative Clustering Algorithm ( bottom-up )
- Use various Similarity Measures(or distance measure) among clusters and the dissimilarity matrix
- Continuously merge nodes that have the least dissimilarity
- Eventually all nodes belong to the same cluster
Similarity Measure 종류 : 각자 서로 장단점을 가지고 있다.
- Min or Max distance measure : tend to be overly sensitive to outliers or noisy data
- Mean measure : the simplest to compute, but it's difficult to define the mean vector for categorical data
- Average measure : it's advantageous in that it can handle both categorical and numerical data, but it has a expensive computation.
Major weaknesses of hierarchical clustering methods
- Can never undo what was done previously
- Do not scale well - Time complexity of at least O(n^2), where n is the number of total objects ( many many possible choice to find best splitation )
Probabilistic Hierarchical Clustering
Algorithmic hierarchical clustering | Probabilistic hierarchical clustering |
Hard to choose a good distance measure(single link, complete link, average link, centroid link) based on application problem. | Use probabilistic models to measure distances between clusters |
Hard to handle missing attribute values; Once one attribute value is missing, it may impact on the quality of clustering. | Generative model: Regard the set of data objects to be clustered as a sample of the underlying data generation mechanism to be analyzed; then you finally find the parameters and find out how they generate this data set. |
Optimization goal is not clear because it's heuristic and it more relies on local search | Easy to understand, same efficiency as algorithmic agglomerative clustering method, can handle partially observed data. |
We can assume like this..

If we have many points, we can assume these points are actually generated by the Gaussian Distribution.
 |
| Gaussian Distribution |
Suppose if we already got partition the whole set of points into m clusters ( C1, ... ,Cm );
merge된 quality of the overall clustering을 구할때, new clustering - original clustering을 해준다. SSE는 merge된 new clustering에서 더 높기 때문에..
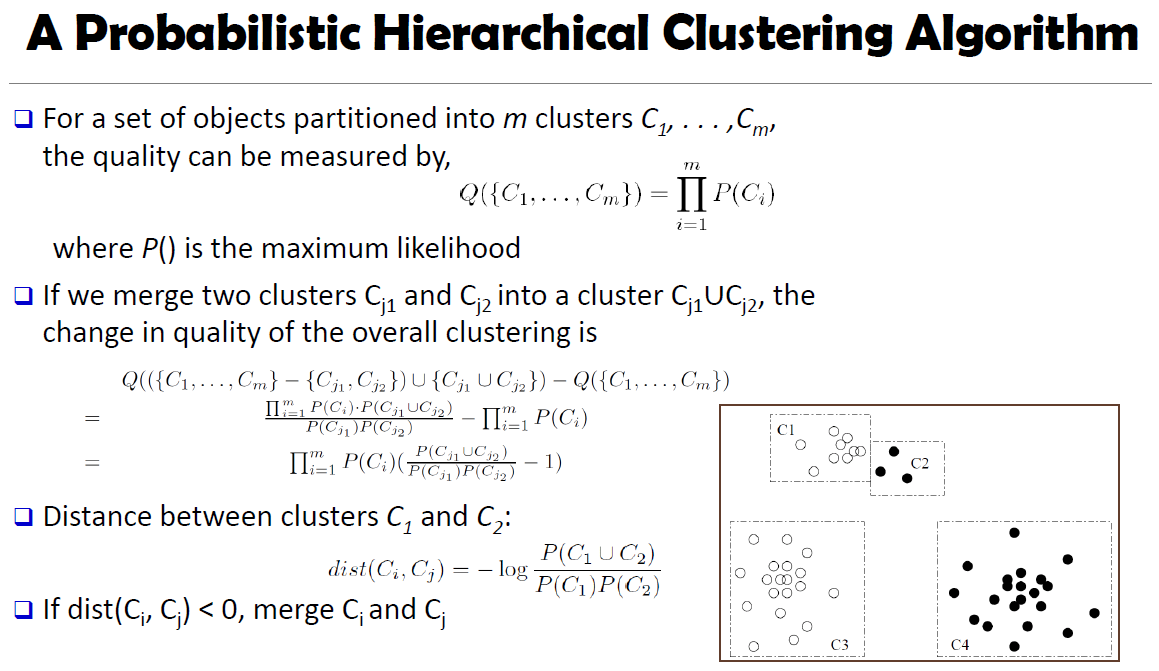
즉, P(C1 C2) / P(C1)P(C2) 가 1보다 크면, 서로 merge한다. 다시 말해, P(C1 C2) 확률이 P(C1)P(C2) 확률보다 크면, 서로 근접해있다고 간주하고 서로 merge한다. 보통 멀리 떨어져 있으면, P(C1 C2) 확률이 낮다.
정리..
- When measuring the quality of a clustering, we take the product of the likelihood of each individual cluster.
- Two clusters are merged if their distance defined in the probabilistic setting is > 0.
- Probabilistic hierarchical clustering is considered a generative model: the set of data objects to be clustered is assumed to be drawn from some underlying data generation mechanism.
Lecture 5
Density-Based and Grid-Based Clustering Methods
Clustering based on density(a local cluster criterion), such as density-connected points
- Discover clusters of arbitrary shape
- Handle noise
- One scan (only examine the local region to justify density)
- Need density parameters as termination condition
STING: A Statistical Information Grid Approach
- STING(Wang, Yang and Muntz, VLDB'97)
- The spatial area is divided into rectangular cells at different levels of resolution, and these cells form a tree structure.
- A cell at a high level contains a number of smaller cells of the next lower level
- Statistical information of each cell is calculated and stored beforehand and is used to answer queries.
- Parameters of higher level cells can be easily calculated from that of lower level cell, including count, mean, sd(standard deviation), min, max, type of distribution(ex. normal, uniform...).
Lecture 6
Probabilistic Model-Based Clustering Methods
Basic Concepts of Probabilistic Model-Based Clustering
Probabilistic model
- Model the data from a generative process.
- Assume the data are generated by a mixture of underlying probability distributions.
- Attempt to optimize the fit between the observed data and some mathematical model using a probabilistic approach.
Probabilistic model-based clustering
- Each cluster can be represented mathematically by a parametric probability distribution (e.g., Gaussian or Poisson distribution)
- Cluster: Data points(or objects) that most likely belong to the same distribution
- Clustering Process: Parameter estimation so that they will have a maximum likelihood fit to the model by a mixture of K component distributions(i.e., K clusters)
Mixture models
- Assume observations to be clustered are drawn from one of several components.
- Infer the parameters of these components (i.e., clusters) and assign data points to specific components of the mixture.
Expectation-Maximization (EM)
- A general technique to find maximum likelihood estimations in mixture models.
- The EM algorithm for Gaussian mixture model.
Reference
[1] Jiawei Han, Data Mining: Concepts and Techniques, Morgan Kaufmann Publishers Inc., San Francisco, CA, 2005
댓글
댓글 쓰기